Running a business recycling program without measuring results is like driving without a dashboard. You might be moving forward, but you have no idea how efficiently you're getting there—or whether you're burning money along the way.
For California businesses especially, tracking recycling performance isn't optional. State regulations like CALGreen require construction and demolition projects to divert at least 65% of waste from landfills [1]. Without proper records, proving compliance becomes a paperwork nightmare that can delay project sign-offs or trigger penalties.
But compliance aside, measuring your recycling program delivers real operational benefits. You'll spot materials that could generate revenue instead of costing you disposal fees. You'll have hard numbers for budget conversations. And your team will start finding more ways to improve once they can actually see their progress.
This guide breaks down the essential recycling metrics every business should track, shows you exactly how to collect the data, and walks through the calculations step by step. No complicated software required—just the documents you're already receiving from your recycling service.
Five Core Recycling KPIs Every Business Should Track
These five key performance indicators give you a complete picture of your recycling program's health without drowning you in data.
1. Total Recycling Volume (by Weight)
This is your foundational metric—the total pounds or tons of material your business recycles over a given period.
What it tells you: The overall scale of your recycling activity and whether it's trending up or down over time.
How to express it: Pounds or tons per month, quarter, or year.
Why it matters: Volume is the starting point for every other calculation. Without knowing how much material you're recycling, you can't calculate diversion rates, track revenue, or identify trends.
2. Diversion Rate
Your diversion rate shows the percentage of total waste that gets recycled rather than sent to a landfill. This is the number regulators care about most.
What it tells you: How effectively your program keeps recyclable materials out of the waste stream.
How to express it: Percentage (e.g., "We diverted 72% of our waste in Q3").
Why it matters: For California construction projects, you need documentation showing at least 65% diversion to satisfy CALGreen requirements [1]. Even outside construction, diversion rate is the clearest single indicator of program effectiveness.
3. Revenue or Cost Savings Generated
This metric tracks the financial return from recycling—either money received for valuable materials like copper or aluminum, or disposal costs you avoided by recycling instead of landfilling.
What it tells you: The direct economic impact of your program in dollars.
How to express it: Dollars per month, quarter, or year.
Why it matters: When you can show that recycling 10 tons of scrap metal last quarter generated $3,000 in payouts and saved another $650 in disposal fees, budget conversations get much easier.
4. Material Mix Breakdown
Your material mix shows what types of recyclables you're generating and in what proportions—ferrous metals (steel, iron), non-ferrous metals (copper, aluminum, brass), cardboard, e-waste, and so on.
What it tells you: Which material streams dominate your waste and where to focus improvement efforts.
How to express it: Percentage of total volume by material type.
Why it matters: If 60% of your recycling volume is low-value steel but you're throwing away copper wire mixed in with other scrap, you're leaving money on the table. Material mix data shows you where to look.

5. Pickup Frequency
This metric tracks how often you schedule recycling pickups or haul materials to a recycler.
What it tells you: Whether your logistics are optimized for your actual generation patterns.
How to express it: Number of pickups per month or average days between pickups.
Why it matters: Too many small pickups waste time and potentially incur unnecessary trip charges. Too few mean materials pile up, creating safety hazards and storage problems. The right frequency balances efficiency with practicality.
How to Collect the Data You Need
The information for these metrics already exists in documents you're generating or receiving. You don't need specialized equipment—just consistent record-keeping.
Weight Tickets: Your Primary Data Source
Every legitimate recycling service provides itemized weight tickets showing exactly what materials were collected and their weights [2]. These tickets are the foundation of your tracking system.
When you receive a weight ticket, look for:
Date of pickup or delivery
Material type (e.g., "bare bright copper," "insulated wire," "baled cardboard")
Weight in pounds for each material type
Total weight across all materials
Price per pound (if applicable)
Total payout or service charge
File these tickets consistently. A simple folder system—physical or digital—organized by month works fine. The goal is being able to pull all tickets from any given period without hunting through random piles.
Pro Tip: If your weight tickets aren't itemized by material type, ask your recycling partner for more detailed documentation. You need that breakdown to calculate material mix and identify high-value opportunities [3].

Service Invoices and Hauler Records
Your recycling service invoices often summarize multiple pickups and provide running totals. Review these monthly to verify they match your weight tickets.
For waste hauling (materials going to landfill), request invoices that show:
Volume or weight of material hauled
Destination (landfill vs. recycling facility)
Cost per haul or per ton
If your hauler provides only volume (cubic yards) rather than weight, you'll need to estimate weight for accurate diversion calculations. Ask if they can provide weight data instead—many haulers weigh loads at the disposal site and can include this on invoices.
Internal Logs for Generation Patterns
For materials that accumulate before pickup, a simple internal log helps you understand generation patterns and plan pickups more efficiently.
A basic spreadsheet with date, material type, and estimated quantity works. Even rough estimates ("about half a pallet of cardboard" or "three 55-gallon drums of scrap steel") provide useful trend data over time.
Estimating Weight When You Don't Have a Scale
Many businesses don't have scales on-site. Here are practical approaches for common materials:
For cardboard:
A standard bale (roughly 48" x 30" x 42") typically weighs 800-1,200 pounds depending on compression
Loose, uncompressed cardboard runs roughly 50-100 pounds per cubic yard
For scrap metal:
A 55-gallon drum of mixed light steel scrap weighs approximately 200-400 pounds
A full gaylord (bulk box) of loose steel scrap typically weighs 1,500-2,500 pounds depending on the material
For aluminum cans:
A 30-gallon trash bag of crushed aluminum cans weighs roughly 10-15 pounds
These are rough estimates for planning purposes. Your recycling partner's scale provides the accurate numbers for tracking and payment [2].
Step-by-Step Calculations for Each Metric
Here's how to turn raw data into actionable metrics. We'll use example numbers you can replace with your own.
Calculating Total Recycling Volume
Step 1: Gather all weight tickets from your chosen time period (month, quarter, or year).
Step 2: Add up the total pounds for each material type.
Step 3: Sum all material types for your total recycling volume.
Example calculation:
| Material | Weight (lbs) |
| Steel | 4,200 |
| Copper wire | 320 |
| Aluminum | 580 |
| Cardboard | 1,800 |
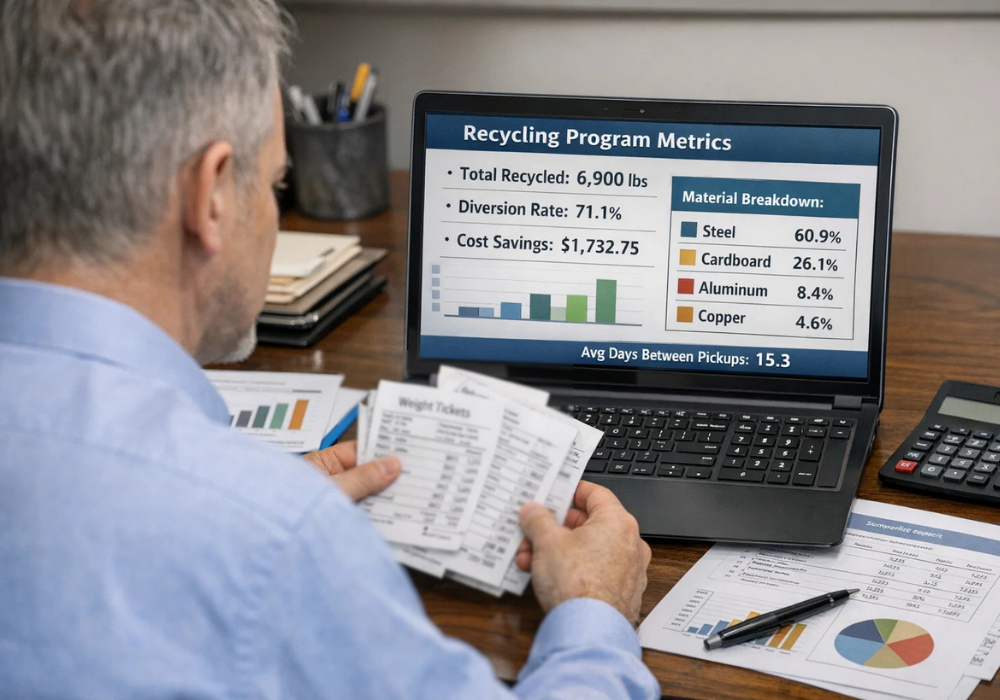
| Total | 6,900 |
Your total recycling volume for that period: 6,900 pounds (3.45 tons).
Calculating Diversion Rate
Step 1: Determine your total recycling volume (from the calculation above).
Step 2: Get your total landfill waste volume from hauler invoices. If your hauler provides only cubic yards, ask for weight data or use industry conversion factors.
Step 3: Add recycling volume and landfill waste to get total waste generated.
Step 4: Divide recycling volume by total waste generated, then multiply by 100.
Formula:
Diversion Rate = (Recycling Volume ÷ Total Waste Generated) × 100
Example calculation:
Recycling volume: 6,900 lbs
Landfill waste: 2,800 lbs
Total waste generated: 9,700 lbs
Diversion Rate = (6,900 ÷ 9,700) × 100 = 71.1%
This exceeds California's CALGreen minimum of 65% for construction projects [1].

Calculating Revenue or Cost Savings
Step 1: From your weight tickets or service summaries, record the payout received for each material type.
Step 2: If you previously paid for disposal of recyclable materials, calculate what that would have cost at your waste hauler's per-ton rate.
Step 3: Add payouts received plus disposal costs avoided.
Example calculation:
| Material | Weight (lbs) | Rate/lb | Payout |
| Copper wire | 320 | $2.85 | $912.00 |
| Aluminum | 580 | $0.55 | $319.00 |
| Steel | 4,200 | $0.08 | $336.00 |
| Subtotal: Payouts | $1,567.00 |
Disposal cost avoided (if this metal had gone to landfill at $65/ton):
5,100 lbs of metal = 2.55 tons
2.55 × $65 = $165.75 in avoided disposal fees
Total financial benefit: $1,732.75
That's real money back in your budget—and it shows exactly where the value comes from.
Calculating Material Mix Breakdown
Step 1: List each material type and its total weight from your records.
Step 2: Divide each material's weight by total recycling volume.
Step 3: Multiply by 100 to get percentages.
Example calculation:
| Material | Weight (lbs) | % of Total |
| Steel | 4,200 | 60.9% |
| Cardboard | 1,800 | 26.1% |
| Aluminum | 580 | 8.4% |
| Copper wire | 320 | 4.6% |
| Total | 6,900 | 100% |
This breakdown reveals that steel dominates your recycling stream—useful when planning storage capacity, scheduling pickups, or negotiating rates with your recycling partner.
Calculating Pickup Frequency
Step 1: Count the number of pickups during your measurement period.
Step 2: Divide the number of days in that period by the number of pickups.
Example calculation:
Measurement period: Q3 (92 days)
Number of pickups: 6
Average days between pickups = 92 ÷ 6 = 15.3 days
Now compare this against your actual needs:
Are materials overflowing storage areas before pickup day? Frequency needs to increase.
Are pickup loads consistently light? You might consolidate for efficiency.
Is there a pattern—like cardboard piling up faster after certain shipments arrive?
Setting Annual Targets That Drive Improvement
Once you have baseline data from a few months of tracking, you're ready to set meaningful targets.
Realistic Target-Setting Guidelines
For diversion rate: If you're starting below 70%, aim for 5-10 percentage point improvement per year. If you're already above 75%, a 2-5 point improvement represents significant progress. Getting from 85% to 90% is much harder than getting from 65% to 75%.
For recycling volume: More volume isn't always better—it could mean you're generating more waste overall. Instead, track volume alongside production or revenue metrics. A useful target: "Maintain or increase recycling volume while reducing total waste generated."
For financial return: Set targets based on improving material capture (separating high-value metals instead of mixing them with steel) and reducing logistics costs (fewer emergency pickups, better planning).
Making Targets Actionable
Break annual targets into quarterly checkpoints. A goal of "increase diversion rate from 65% to 75%" becomes:
Q1: 67%
Q2: 70%
Q3: 73%
Q4: 75%
Assign responsibility for tracking and reporting. Someone on your team should own these numbers and present updates at regular intervals—not because it's bureaucracy, but because accountability drives results.
Sharing Results With Your Team
Metrics locked in a spreadsheet don't change behavior. Getting your team engaged with the numbers makes improvement possible.
What to Share and How Often
Monthly: Post a simple one-page summary with total recycling volume, diversion rate, and any notable changes. Put it where employees actually see it—break room, loading dock, job site trailer.
Quarterly: Provide a more detailed breakdown including material mix, financial impact, and progress toward annual targets. Use this as an opportunity for brief team discussions about what's working and what's not.
Annually: Compile a year-end summary comparing performance to the previous year. Celebrate wins—even small ones—and identify priorities for the coming year.
Making Data Meaningful
For frontline employees, translate numbers into terms that actually mean something:
"Last month we recycled 3.2 tons of steel—that's the weight of two full-size pickup trucks."
"Our recycling program generated $4,800 last quarter. That covered the cost of new safety equipment."
"We diverted 73% of our waste from landfill this month—eight points better than last year."
For management or corporate sustainability teams, focus on diversion rates, compliance documentation, and cost-benefit analysis.
Creating Accountability Without Bureaucracy
Keep reporting simple. A complicated system that nobody maintains is worse than a basic one that gets used consistently.
Consider designating a "recycling point person" on each shift or at each location who ensures materials are sorted properly and logs notable information. Rotate this responsibility periodically to build awareness across the team.
How Your Recycling Partner Supports Better Tracking
Working with a professional recycling service dramatically simplifies data collection. The right partner becomes an extension of your measurement system.
Documentation You Should Expect
Every pickup should generate a weight ticket itemizing materials and weights. For businesses with regular service, ask about monthly or quarterly summary reports that compile your data automatically.
Your recycling partner should be able to tell you:
Exactly how much of each material type you recycled
Market rates applied to your materials
Your total payout or service charges
If you're not getting this level of detail, ask for it. Any reputable service provides transparent documentation—it protects both parties and supports your compliance needs [3].
Using Partner Data for Better Decisions
Review your documentation regularly for patterns. You might discover that one location generates significantly more aluminum than another, or that cardboard volumes spike predictably after certain shipments arrive.
These insights help you plan storage, schedule pickups more efficiently, and train staff on better sorting practices.
A good recycling partner will also flag opportunities you might miss: "We noticed you're generating a lot of insulated copper wire mixed with other scrap—if you separate it out, you'll get a better rate."
Creating a Simple Tracking System
You don't need specialized software. Here's a practical approach that works for most businesses.
Basic Spreadsheet Setup
Create a spreadsheet with these columns:
Date
Material type
Weight (lbs)
Revenue or cost
Pickup number
Notes (location, unusual items, etc.)
Enter data from each weight ticket. Use simple formulas to automatically calculate monthly totals, diversion rates, and running averages.
Monthly Review Process
Set a recurring calendar reminder to review your recycling data. Spend 15-20 minutes at the start of each month:
Enter any missing data from the previous month
Calculate key metrics
Compare to targets and prior periods
Note any significant changes or anomalies
Update your team summary
That's it. Consistency matters more than complexity.
Annual Documentation Package
At year end, compile:
Monthly summary table showing all key metrics
Year-over-year comparison
Material mix breakdown
Financial summary (payouts received plus disposal costs avoided)
Copies of weight tickets for compliance records
This package supports regulatory compliance, internal reporting, and continuous improvement planning. If you ever face a CALGreen audit or need to document sustainability efforts for a client, you'll have everything organized.
Start Measuring Today
You don't need perfect systems to begin. Start with what you have.
If you have even one month of weight tickets, you can calculate baseline metrics. From there, each month adds to your data set and improves your understanding of what your operation actually generates.
The businesses that succeed with recycling programs share one trait: they pay attention to the numbers. Not obsessively, but consistently. They know what they're generating, where it goes, and what it's worth.
That visibility drives better decisions, demonstrates value to stakeholders, and turns recycling from a compliance checkbox into a genuine operational advantage.
Ready to get accurate weights and detailed documentation for your recycling program? Call Willis Recycling at (916) 271-2691 to schedule your next pickup and start building the data foundation your program needs.
Frequently Asked Questions
What's a good diversion rate target for my business?
Most California businesses should aim for at least 65-75% diversion as a starting point, which aligns with CALGreen requirements for construction and demolition projects [1]. Highly efficient operations often achieve 85% or higher. Your ideal target depends on your industry, the materials you generate, and your current baseline. Start by measuring where you are now, then set incremental improvement goals of 5-10 percentage points per year.
How often should I review my recycling metrics?
Monthly reviews work well for most businesses. This frequency catches trends early without creating administrative burden. Set aside 15-20 minutes at the start of each month to update your tracking spreadsheet, calculate key metrics, and compare against targets. Quarterly deep dives with your team help with strategic planning and identifying bigger-picture opportunities for improvement.
What if my waste hauler doesn't provide weight data?
Request itemized invoices that include weights rather than just volume or container counts. If your hauler can't or won't provide this data, consider switching to one that offers transparent reporting. Accurate weight data is essential for calculating diversion rates and demonstrating compliance—you shouldn't have to guess. For materials going to recycling, your recycling partner should always provide detailed weight tickets [2].
Should I track recycling by location or department?
If you operate multiple facilities or have distinct operational areas, tracking by location reveals valuable patterns. You might discover that one site generates three times more cardboard than another, or that a particular department produces most of your high-value copper scrap. This granular data helps you target improvement efforts where they'll have the biggest impact and identify best practices you can replicate across locations.
How do I get my team engaged with recycling metrics?
Keep it visual and relatable. Post monthly results where everyone can see them, translate pounds into familiar comparisons (like "the weight of a pickup truck"), and connect recycling performance to outcomes people care about—like revenue generated or disposal costs avoided. Simple recognition for improvement, even informal acknowledgment, reinforces the behaviors that drive better numbers. When people see the results of their efforts, they tend to find more ways to improve.
About Willis Recycling
Willis Recycling is a family-owned mobile recycling service based in Sacramento, serving businesses throughout Northern California. With nearly two decades of industry experience, our team provides on-site scrap metal and cardboard pickup with transparent documentation—including detailed weight tickets and itemized summaries that support your recycling program measurement needs. We handle everything from copper and aluminum to steel, cardboard bales, and e-waste, giving you accurate data and fair evaluations for every pickup.
Cited Works
CalRecycle — "Construction and Demolition (C&D) Debris Recycling Requirements." https://calrecycle.ca.gov/lgcentral/library/canddmodel/
Willis Recycling — "How It Works." https://www.willisrecycling.com/
Willis Recycling — "Commercial Scrap Metal Pickup Sacramento." https://www.willisrecycling.com/commercial-scrap-metal-pickup-sacramento/